Observations
From the very beginning, the numerical work will be accompanied by the work with observations and simulations of signal for future X-ray missions. In any stage of the data reduction in X-ray domain they need models to interpret the data. In the public fitting packages (e.g. XSPEC) many phenomenological models allow to fitting of each spectral component (continuum or lines) separately. However, the main objective of this project is to fit all spectral components in a self-consistent way with the use of advanced models computed by us.We constantly approve our analysis tools on order to explain X-ray data from the most advanced missions as: XMM-Newton, NuSTAR, Chanda, XRISM, and others.

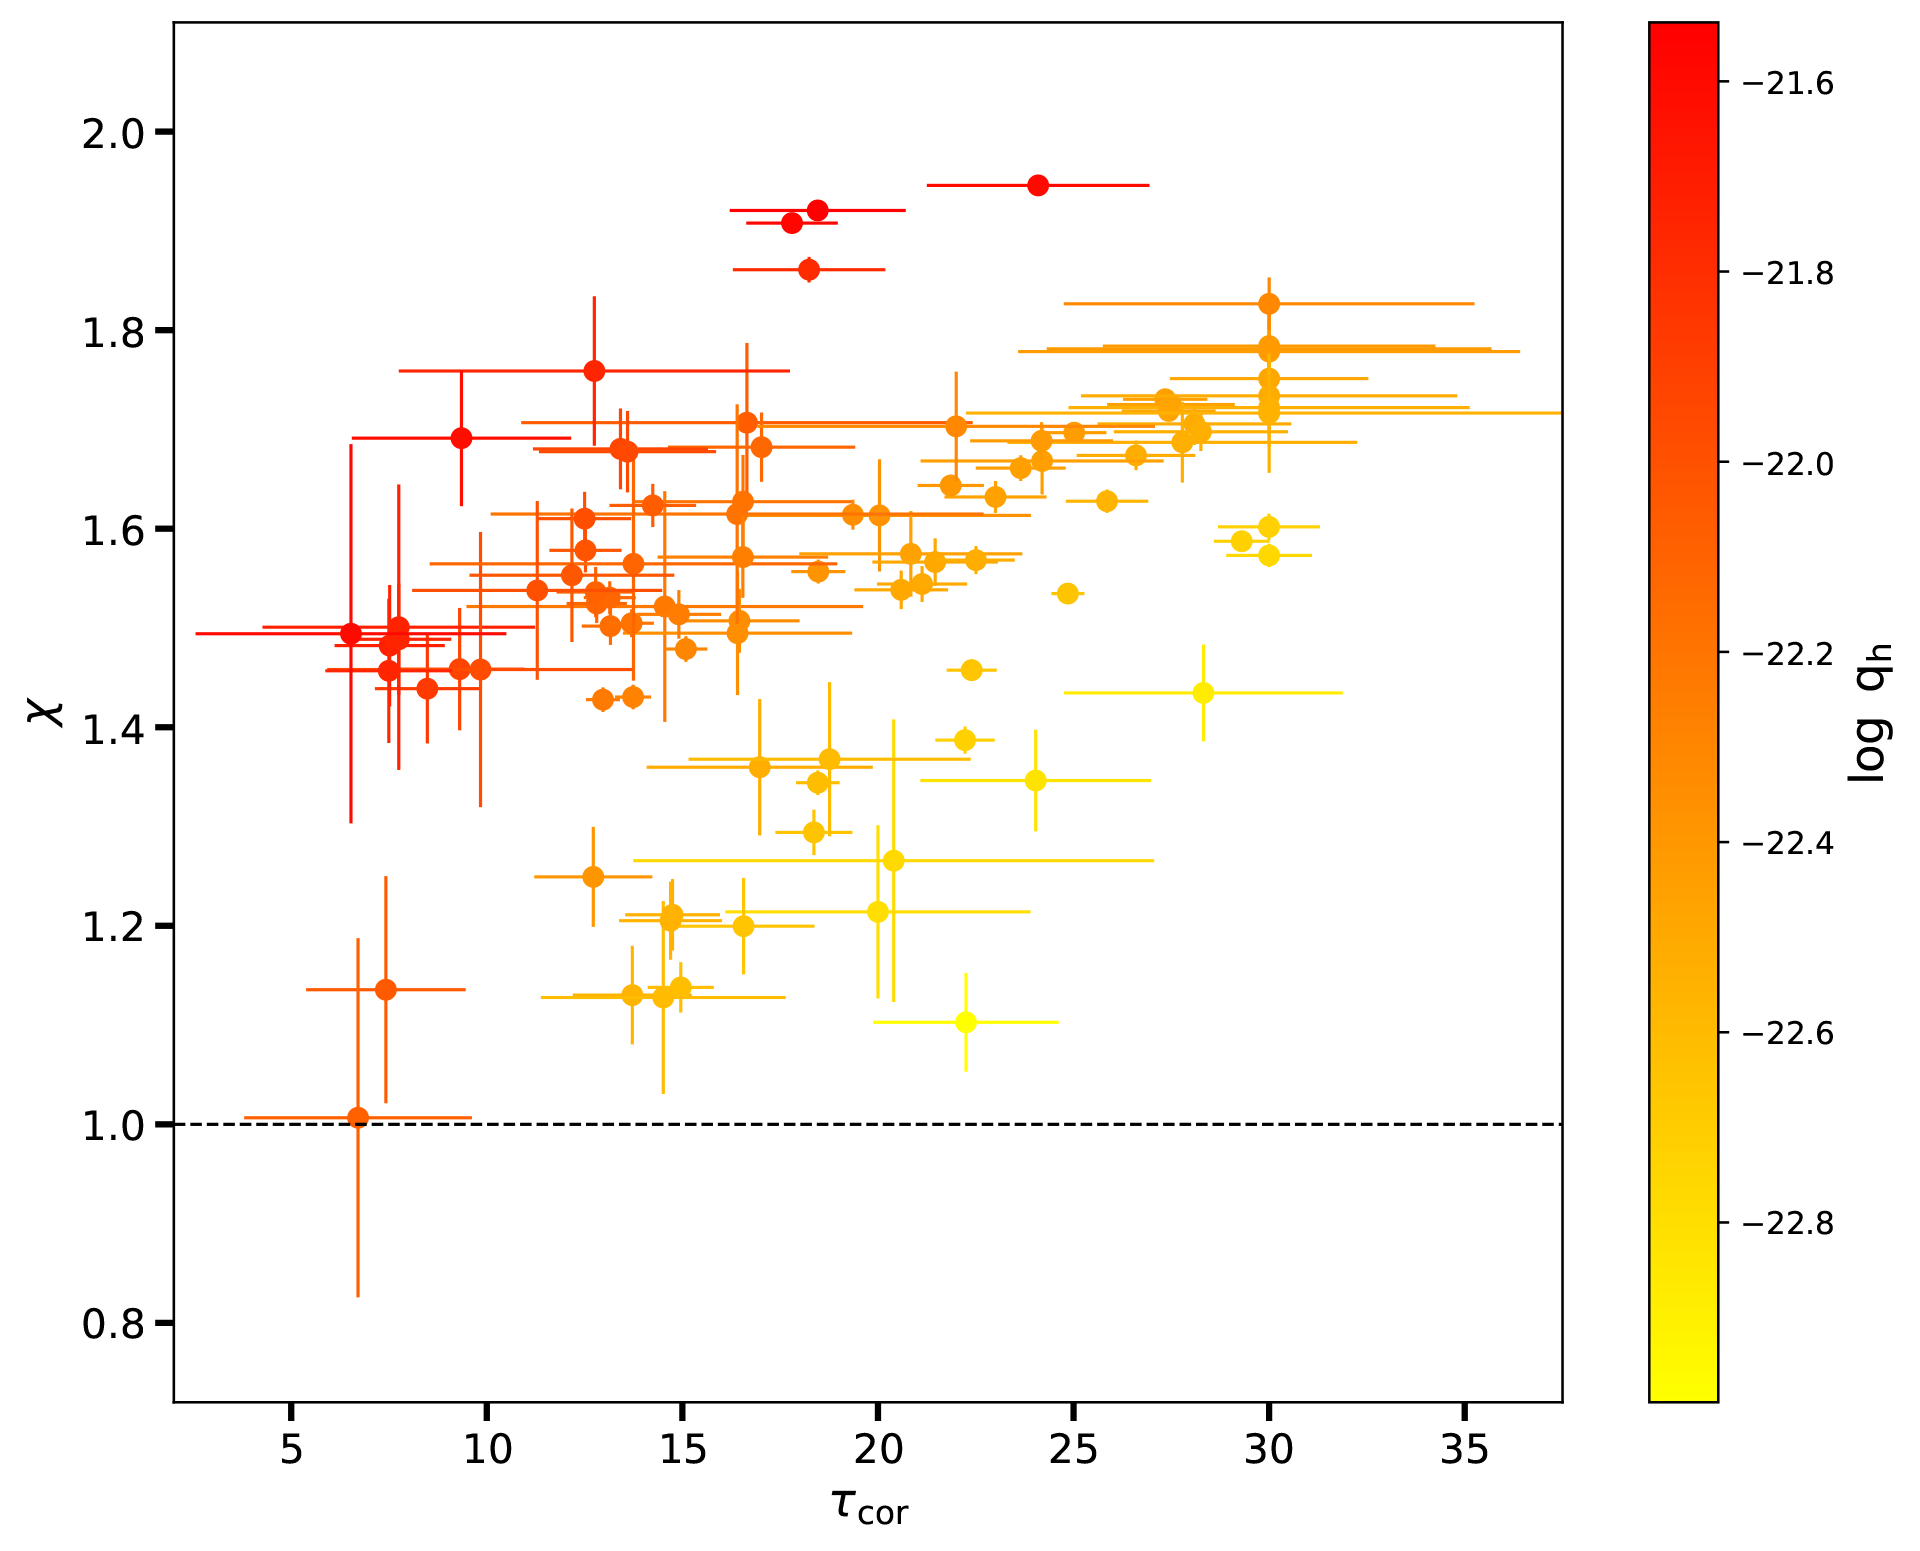
Our new result on X-ray soft excess from a sample of 94 data sets of 22 AGN fitted with the use of TITAN models.
A scatter plot showing the dissipation factor χ against warm corona optical depth, color-coded by
the total internal heating value shown on the side color bar. Black dotted line at χ=1.0 denotes the transition region between passive disk -- χ>1, and active disc – χ<1. Palit et al. 2024, submitted to A&A.
